Weekend Trading Analysis: A Detailed Breakdown of Market Momentum BTC 8th - 9th March 2025
Bitcoin continued its downward trajectory over the weekend, following the bearish sentiment from the previous week. The price action reinforced the ongoing trend, with clear rejections at key levels and confluences that signaled further downside movement. Traders who remained attentive to these setups would have had strong opportunities to capitalize on market momentum.
30-Minute Analysis
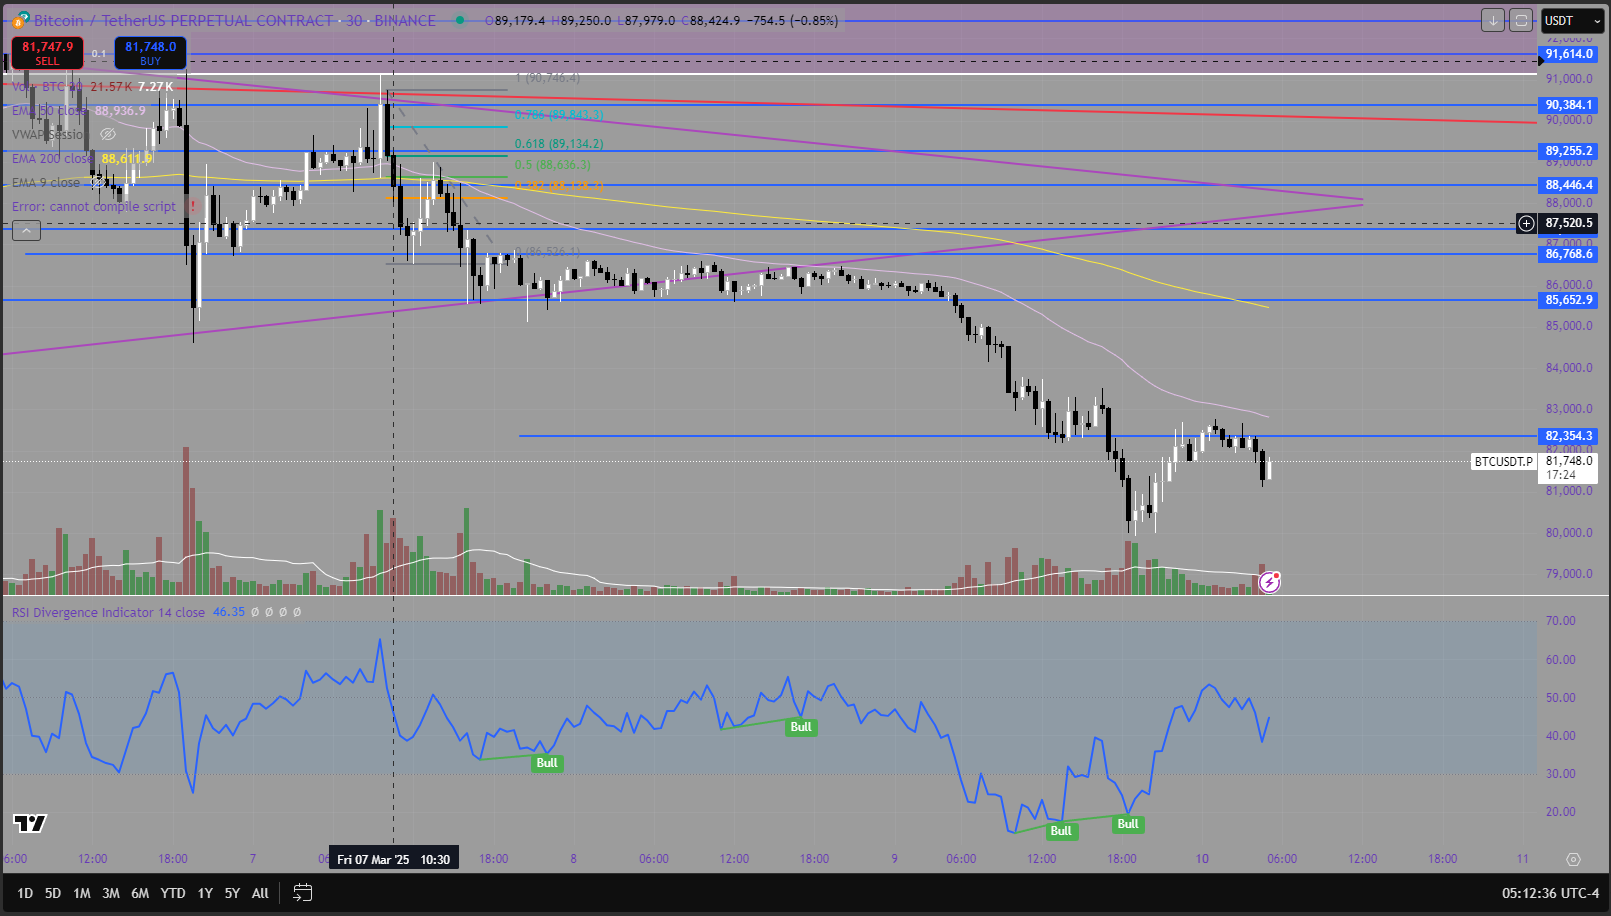
BTC began Saturday’s session by rejecting a key resistance level at $90.3K, marking a significant turning point as the price formed a new bearish structure. A pullback followed, reaching $88.4K, where the price rejected this level decisively. The confluence of factors at this zone, including a rejection at the golden Fibonacci retracement zone and the 50 and 200 EMAs, provided strong confirmation of continued bearish sentiment. Shortly after, a bearish EMA crossover further solidified this outlook.
As expected, BTC continued downward, finding support at the $85K level. This zone was reinforced by a wedge pattern on the 4-hour timeframe, a structure that many traders identified. The break of this wedge came with an increased level of weekend trading volume, confirming the significance of the move. Following this, BTC rejected the wedge structure once again with an engulfing candle, providing a strong entry point for traders. Further confirmation came from a rejection at the 50 EMA, signaling another opportunity for short positions.
As price action unfolded, BTC broke through the $85.6K support zone with momentum, accelerating its descent to $80.2K. A retest of the prior support level, now acting as resistance, reinforced bearish sentiment. Additionally, the failure to form a new higher high further confirmed the likelihood of continued downside pressure leading into Monday’s open.
Daily Analysis
From a broader perspective, BTC rejected the key $91K - $93K zone, an area that previously served as a strong support level. This rejection played a pivotal role in maintaining the downward trend. More significantly, BTC re-entered a descending trendline that has acted as both support and resistance since December 2024.
Adding to the bearish sentiment, BTC also broke back below the 200 EMA. However, the volume on this move was relatively lower, which is expected given that this occurred over a weekend. Traders should take this into account when assessing the strength of the breakout.
Looking ahead, the next major support level lies in the $72K - $74K range. This zone represents an uncharted range for BTC in its current trend cycle, making it a critical area to watch for potential reaction points.
Conclusion
The weekend price action reaffirmed BTC’s bearish structure, with multiple confirmations aligning to indicate further downside potential. The failure to establish new highs, the bearish EMA crossover, and key level rejections all point to continued weakness as the market moves into Monday’s session. With the next key support in the $72K - $74K region, traders should remain cautious and watch for potential setups as BTC navigates this untested price territory. As always, keeping an eye on volume and market reactions at these critical levels will be essential in determining Bitcoin’s next move.


